Harvesting and visualizing data

OK. The datalab should know how to harvest data. And we should know how to visualize them. Otherwise – how will we be able to help our users?

Libraries should have HUGE amounts of data. Unfortunately, we have not been able to make much headway making them publicly accessible. What to do? Get some data from another source. Twitter appears to be a very important way to communicate. I do. Why not harvest the number of tweets I tweet, and visualize them?

The correct way to do this, would be to harvest the data from Twitters API. That requires a developer account, which requires a regular account that has been verified by SMS. My phone company does not support this feature. However – the data is freely available on the web. Just go to my twitterprofile, and take a look.

And how do I get this data? Enter Python. Use the urllib2 library to harvest the site:

import urllib2 
page = urllib2.urlopen('http://www.twitter.com/chrbknudsen')

Then convert it to something that we can work with:

from BeautifulSoup import BeautifulSoup
soup = BeautifulSoup(page.read())

page.read() returns the content of the site we read. BeautifulSoup converts that content into an object with a lot of nifty methods. Take a look:

tweets = soup.find('li', {'class' : 'ProfileNav-item ProfileNav-item--tweets is-active'}).find('span', {'class' : 'ProfileNav-value'})

BeautifulSoup lets us find content that is enclosed by specific tags. The number of tweets is in a LI-tag, with the class “ProfileNav-item ProfileNav-item–tweets is-active”. But there is more under that tag than just the number of tweets. Therefore we use the method “find” twice, now with the tagt SPAN, and the class “ProfileNav-value”.

Now we have the number of tweets (the moment I reach a thousand tweets, we will have to do something – twitter shows two thousand tweets as 2,000. And if I have even more, they might show 14563 tweets as 14.6td. Simple conversions to remove punctuation and changes 14,6td to 14600. We loose some precision, but nevermind).

OK. Now we have a Python script, that can access a twitter-profile, and harvest the number of tweets. On a Raspberry Pi (or other *nix-boxes) we can run a cron-job to harvest once every hour. Note that this method of harvesting is not exactly approved by Twitter.

We need to save the data. Enter Google Spreadsheets. I wont go into details about how to aquire the json-file that is used to authorize your use of Google Spreadsheets. Maybe I’ll get back to it. But we need some libraries:

import json
import gspread
import ssl
from oauth2client.client import SignedJwtAssertionCredentials
Those are used by this code:
json_key = json.load(open('client_secret_2.json'))
scope = ['https://spreadsheets.google.com/feeds']

ssl._create_default_https_context = ssl._create_unverified_context

credentials = SignedJwtAssertionCredentials(json_key['client_email'], json_key['private_key'].encode(), scope)

gc = gspread.authorize(credentials)

wks = gc.open("twitterdata").sheet1

Note that you will need to provide a full path to the json-file in order to run the cron-job. That fact gave me an ulcer yesterday…

We have connected to Google Spreadsheets through the Google API, and we have opened the spreadsheet “twitterdata”, and the first worksheet. We now have an object “wks”, that we can manipulate.

We use this method:

wks.append_row(rowToAdd)

That appends a row with some data to the active sheet. The data is contained in a list, “rowToAdd”. Now we just have to make sure that there is some data there. Before calling rowToAdd, we populate the variable:

rowToAdd = [time.time()]
rowToAdd.append(tweets)

Yeah, we need to import time as well.

That was it. Not exactly a working example, but a pretty accurate description of my thought processes writing it.

So far so good. Theres a cronjob running on an RPi back home, it harvest the number of tweets once every hour, and writes it to a google spreadsheet.

Now we need to visualize it.

Enter Highcharts. It’s free, its written in javascript and it can be embedded.

<div id="chart_container">
</div>
<script src="//code.highcharts.com/adapters/standalone-framework.js"></script>
<script src="//code.highcharts.com/highcharts.js"></script>
<script src="http://code.highcharts.com/modules/data.js"></script>

<script>
new Highcharts.Chart({
 "chart":{
 "backgroundColor":"#fefefe",
 "renderTo":"chart_container",
 "type":"spline"
 },
 "title":{
 "text":"Title"
 },
 "colors":["#476974","#3ca1c1","#4ccbf4","#96dff6","#c9e8f6"],
 "legend":{
 "enabled":true,
 "margin":30
 },
 data: { googleSpreadsheetKey: '[enter spreadsheetkey here]', 
 googleSpreadsheetWorksheet: 2, 
 },
 });
</script>

That was it. This is the result:

Some work still needs to be done. The UNIX-time is not formatted as dates – it needs to be converted to javascript-time. This is not actually live data. And theres a bunch of other details I would like to tinker with. But I’m still rather satisfied.
Disrupting access to scholarly journals III

OK, part 3. Here is part 1 and part 2.
I made the rookie mistake of not following the ICanHazPDF etiquette: I did not provide a DOI for the article I requested.
No surprise – two weeks later, I have still not received a PDF.

This morning I tried again. Tweetdeck was supplied with a tweet containing the DOI, the hash-tag and my mailadress, and tasked to tweet at 9.00 AM local time.

9.03 my tweet was retweeted by @shecanhazpdf.

9.31 I recieved an e-mail with the subject “Yes, you can haz :)” – and the PDF. Please note: This is a paper that I have co-authored and that I have legal access to, through my work.

Where did it come from? Good question. The first rule of Fightclub is that you do not talk about Fightclub. Similarly, you do not reveal who fulfilled your request. Odds are that whoever helped me, is breaking a license agreement. The e-mailadress I got the PDF from is rather anonymous, but it is a good guess that the owner is a night elf hunter from the same timezone as Denmark. Not that it matters, but it would be interesting to hear what motivation there is behind the mail.

Anyway. Our Inter-Library-Loan department is quick, but probably not that quick. This was a test. The result is clear: Make your request in the proper way, and it is fulfilled in 30 minutes.

Is this going to disrupt the access to scholarly journals, provided by libraries?

While I’m waiting for a Twitter API-Key

I’m working on a series of posts about the ICanHazPDF phenomenon. You can find the latest here. What I would really like to do, is to harvest tweets with the hash-tag, and analyze the data. That requires an API-Key from Twitter. And for some reason, that is a bit difficult.

Anyway, what other data could be interesting to harvest from social media sites? Data that would actually reveal things that are not common knowledge.

LinkedIn perhaps. If activity from persons employed at a given workplace was harvested – could that data, or rather changes in that data, be used to tell something about that place?

In other words: If the data was available, would we see an increase in activity from employees at The Royal Library after the latest cutbacks were announced?

And could trends like that be used to reveal when it would be a good idea to buy or sell stock in a company?

Disrupting access to scholarly journals

What happens when scholars bypass the library? In new and probably illegal ways?

Why would you want to pay 30 USD for a 20 year scientific article?

It’s nothing new. Scholars have always exchanged information. In olden days, before the deluge of videos shaming cats for silly behaviour, scientist regularly needed access to papers that were not available through their university library. When that happened, they asked their secretary to write the author of the paper, and request a copy.

It was institutionalized. When you submitted a paper to a journal, you were expected to buy a number of preprints of the paper from the journal. That  covered some of the cost of printing the journal, and you were welcome to distribute the preprints among your colleagues. You were annoyed that you had to buy them, but you actually needed them, to promote your own work, so that was OK.

Then the internet happened. Scholarly journals became digital, information suddenly had the potential to become very free. Scholars had instant access to huge numbers of scientific papers. Information could travel around the globe almost instantly. What also happened, was that the cost of subscribing to the journals went through the roof. No university library today can afford to subscribe to all the journals that researchers want access to. The publishers still want to be paid for the access, so they erect paywalls around their content. If your university library does not subscribe to the journal you want to read, you can pay to get access.

Okay. The scene is set. We have scholars, who believes that information should be free. We have information with a very high potential for being set free. And most of that information is hidden behind paywalls, where some scholars have access, and others dont.

Solution? Write to a colleague that has access, and ask him to email you a pdf.

Again, nothing new. We’ve seen it before. If we could gain access to the emails, we could describe the networks exchanging pdfs.

It might even be possible to describe this situation with nice formulas. It is probably analogous to the potential energy harnessed by cells, then there is a difference in the concentration of sodium ions across a cell membrane.

But now something interesting has happend (it actually happened a couple of years ago).

Researchers have begun using Twitter to request copies of papers they otherwise wouldnt have access to. They tweet the hash-tag “#ICanHazPDF, along with a reference and an email-adress. And kind people around the world, with access to the paper, send a pdf-copy of it. Quick. Easy. Free.

That was a very long introduction, inspired by this post. Whats next? In the next couple of posts, I’ll try to analyze what the consequences of this new-ish phenomenon might be. Maybe we’ll even get some numbers.


Rotoscoping

I ved godt hvad det er – I så det i A-HAs hit “take on me”.

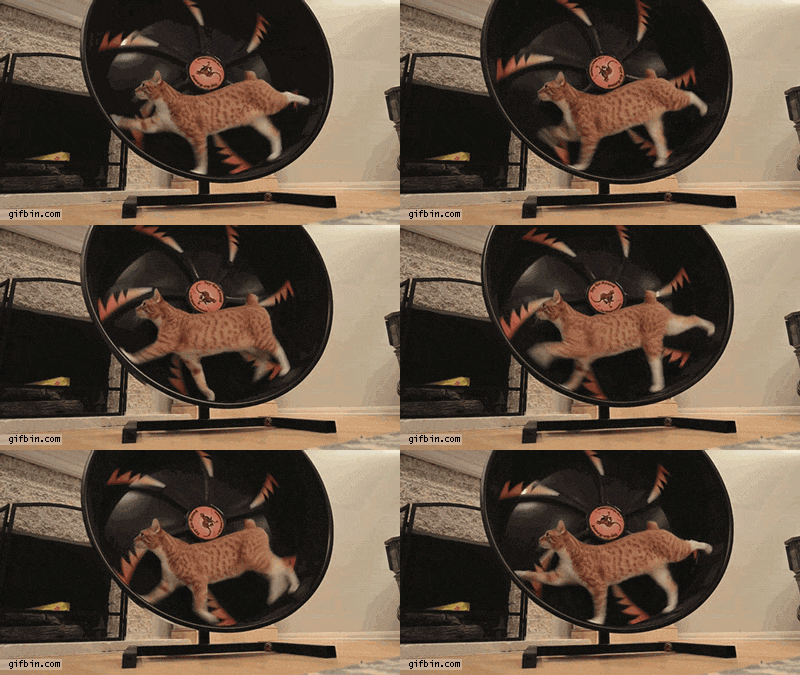
Her er en katte-gif. I gamle dage var GIF bare et grafikformat. De kunne godt nok animeres, men det var lidt tungt, filer fyldte for meget og sådan. Og så blev de primært brugt til at lave hjemmesider der ikke var til at holde ud at se på.

I dag er de på mode igen – så meget at folk ikke tror at GIF også bare er et billedformat, men at de fuldstændigt er associeret med animerede gifs.

Men det var ikke det der var den egentlige pointe. Pointen var at lave en rotoscopet animeret gif.

Man starter med at finde en gif. Her er en god en, der fint illustrerer hvordan jeg har oplevet de sidste ca. 24 timer (nu er der kun fem kvarter til det er weekend. Yay!)

giphy

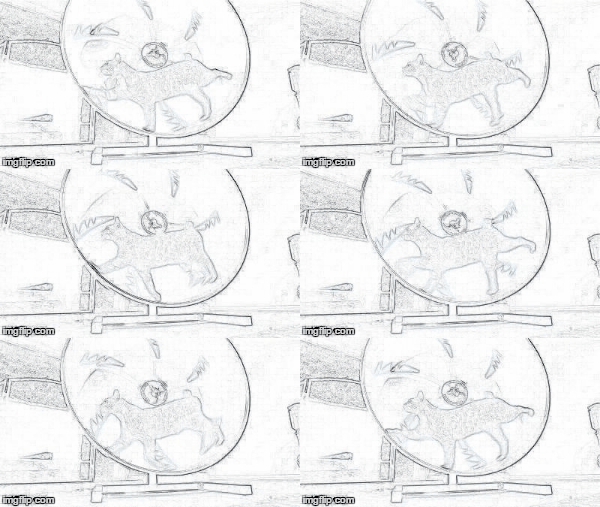
Og her er så resultatet af en rotoscoping:

t00zm

Nå. Hvad gjorde jeg så?

  1. Jeg startede med at lede efter et billede der udtrykte min sindstilstand. Egentlig var det et hamsterhjul med en hamster jeg ledte efter. Men det passede sgu meget godt at katten havde fået skåret halen af (stakkels kat). Giffen blev downloaded.
  2. I IrfanView (enestående fantastisk program!!!) splittede jeg filen af i dens enkeltbilleder.
  3. Hvert enkelt billede fik følgende behandling:
    1. CTRL-E – vælg edgedetection. Det finder “kanterne” på billederne, der hvor der er overgange mellem forskellige farver.
    2. ALT-I (for image), vælg negative – alle kanaler.
    3. Gem.
    4. Egentlig burde hvert enkelt billede også konverteres til gråtoner, det ville få det endelige resultat til at fylde mindre. Det var jeg for doven til.
  4. Herefter skulle billederne samles til en animeret gif igen. Det skete på ImgFlip. Der er andre værktøjer. Jeg har bare ikke fået downloadet GIMP endnu, efter min forlovede har opgraderet computeren til windows something (10?). Så jeg hoppede på nettet og fandt noget.
  5. Vupti! Der er et vandmærke der irriterer og sådan. Og næste gang laver jeg øvelsen under punkt 3 i ImageMagick i stedet. Den kan nemlig automatiseres. Det kræver en særligt desillusioneret hjerne at sidde og gøre det i hånden for par-og-firs billeder.

Hep! Sådan.

Rotoscoping

It’s been a little quiet around here. A lot of things have happened, maybe to many given the activity here.

We are getting ready to open the DataLab. The InnovationLab have had its first workshops (and I have to build a gadget to fix a problem with one of the printers – it is going to be ugly. But it will work!)

But right now I’m waiting for someone to send me an image. Before I get that, I cant send out our annual user satisfaction survey. So – an unexpected break!

Therefore a post that would normally show up at another blog, dedicated to geeking out. But relevant here.

One of the latest trends in library marketing is the promotional video. At our library, we appear to be fond of LEGO stop-motion animations. But “my” library is a small one, and we are frequently left out of the videos. For good reasons, but still, something must be done!

It is time consuming to produce a stop-motion video. And its been done. Instead we should do something that has’nt been done before. But it should be cool. Enter the music video for AHAs hit Take On Me. It used a technique called rotoscoping, to mix ordinary imagery with sequences that appear to have been drawn in hand.

How to do that?

  1. Download ImageMagick
  2. Make an ordinary video
  3. Download IrfanView
  4. Split the video into individual frames, using IrfanView
  5. Process the frames with ImageMagick – edgedetect and negate are the filters we’re going to use her
  6. Splice all the frames together again to a video

Simple. Allthough it does require a lot of time. But first of all – sell the idea, and make a storyboard.

Smartphone del VI – A new wire

Der var nu forbindelse mellem Arduino og Raspberry pi. Og nu skulle telefonen så gøres klar til at blive samlet igen. Min plan var at signalet fra telefonen til Arduinoen skulle gå gennem den gamle telefonledning. Det syntes jeg var mest nørdet. Men… I sådan en ledning mellem en telefon og et telefonstik, er der tre ledere. Og ledningen fungerer altså bedst hvis alle tre ledere fungerer. Den røde var død…

Så er rådne dyr gode. Ned i Brinck. De havde ikke den slags ledninger. Hm. Hvis det ikke kunne blive med et gammeldags telefonstik, så skulle ledningen i det mindste ligne originalen. Det der kom tættest på, var et netværkskabel. Sådan et standard twisted pair kabel med 8 ledere. De er ret tynde, så jeg samlede dem parvis. Og havde nu fire ledere. Men jeg skulle ikke bruge mere end tre. Den fjerde… Jeg ville jo godt have røret med. Jeg kunne bare ikke finde en løsning hvor det ikke gav for meget støj på det egentlige signal fra drejeskiven. Men det kan en fjerde leder klare. De skrueterminaler imellem hvilke der er forbindelse når røret er af, blev forbundet med en pull-down modstand og den fjerde ledning. Og vupti, nu har jeg to signaler fra telefonen. Et hvor jeg kan tælle pulser fra drejeskiven. Og et hvor jeg kan se om røret er af eller på.

Koden skal nu skrives om – det er vist ikke så svært igen, men kræver lidt mere ro i hovedet end der normalt er efter en 10 timers arbejdsdag. Så det bliver ikke lige med det samme. Men nu begynder målet at være i sigte!

R and interruptions

For some interesting reasons, I’m learning Python and R. I’m done with the Codecademy introduction course in Python – and still lacking about 9000 hours of experience.

At the moment I’m doing the R introduction course from Datacamp. Not as good a course as the Codecademy, but good enough.

When I was much younger, and studying at the Technical University of Denmark, this would have been af three-week course, with an estimated workload of 140 hours (yep, we studied for almost 47 hours every week). Now, I have a lot more experience, and should be able to do it faster. On the other hand, I do not have 47 uninterrupted hours to set aside each week. More like 4. And they will be interrupted. At least twice every hour.

A post on DJØF-bladets homepage (in danish) tells of swedish research, revealing that when you are in flow, that is, when you are working at optimum efficiency, it will take 25 minutes to recover from an interruption.

A qualified guess is, that at the current level of interruptions, this three-week course, is converted to an 84 week course.

Moving the print journals

All the print journals, and all print books in closed stacks, have been moved from my little library. We started monday, and was finished friday. More or less, the materials have not yet been placed on their new shelfes at our main library. Now we’re just waiting to get rid of all the empty shelfes, and getting the new furniture for our students. More than 220 square meters for them! The students are looking forward to it, the faculty are worried that it’ll get to cozy at the library, and that the students will be late for classes. Yay!

Is everything just nice and great? No. It is strange, even for the former ebook-coordinator at the royal library, to see all the empty shelfes. Print books and journals have a permanence, that communicatets solidity and symbolises the scientific progress and knowledge in a way that digital ressources simply cannot. At least to people who grew up in the last millenium.

Moving print materials from open to closed stacks also symbolizes the changing world of libraries. We have always been the keepers of knowledge, and paper was the tangible symbols of that knowledge. We know that our mission is to provide access to information, and we know that we are able to do that much more efficiently with digital than with print materials. But it feels profoundly strange to relegate a couple of hundred years accumulated knowledge to closed stacks.

I sincerely believe that this is the future. I believe that the students will get better service even if we move the print material. But it still feels strange.

Internet of Things

One of the more interesting talks at MakerfaireUK was “Fixing the Internet of Things” by Alasdair Allan. The way IoT is made today is with a lot of different standards of communication. That leads to the troublesome conclusion, that none of them actually are standards. And the worrying possibility, that soon we will have to choose not only the wattage of a lightbulb, and the size of it. But also which protocol our “smart” lightbulb uses to communicate with the internet.

Another problem is the lack of privacy. Everything have been hacked. Even the White House mailservers… Allan believes that it is only a matter of time, before we see the first murder committed with the help of smart, internetconnected things.

A promising trend, counteracting these problems, is the way that Moores law helps us. Smart devices are not nessecarily becoming more smart. But they do come with increasing computing power. An interesting article on version2, a danish IT-site, touches on this. Read it here, and notice the competitive advantages companies trying to get in on the german market gets, when they can say that data is not stored on american servers…